A picture is worth a thousand words. You’ve heard this hundreds of times before. So, unless you’re Seth Godin or Leo Babauta, you’ll probably want to include some visual interest to go along with your blog posts. Depending on the content, you may be able to provide your own photos, as might be the case with a product review or some sort of personal statement. But, what about when you can’t?
Yes, while stock photos and royalty-free images can be useful, they’re not enough on their own. While you won’t want to lean into all of these different visual types for every blog post — especially since some will be more labor-intensive than others — they are important tools and options to keep around for when they may be relevant and add value to your blog.
Data Visualizations
Whenever you start talking numbers, some readers are just going to gloss over. Present them with a table or a long list of data and their eyes will just glaze over. Whether you’re handling hard statistics or you’re just trying to make a point, data visualization can be a powerfully useful tool for getting your point across.

One web app that I find is great for this purpose is Meta-Chart. (It’s also free.) It’s really versatile, making it really easy to create everything from a Venn diagram to a line chart, a pie chart to a scatterplot. What’s great is that you don’t necessarily need to gather the data yourself, but when you present that data in a more digestible form, like as a chart or graph, you’re adding value and offering a service to your readers.
YouTube Videos
This one feels obvious. Video is playing an increasingly bigger role in just about everything online, as it is more accessible both to create and to consume high quality video these days. If you have the opportunity to share video with your readers, and it’s in a way that provides value, then you should really consider it.
Embedding videos is really helpful for tutorial-type content, like this one on writing an automated email campaign:
It’s also great for more casual and “fun” content that is also more visual in nature, like talking about what it’s like to live with a Tesla Model X:
You don’t need to have an expensive rig to create great videos. Just get started with what you have and upgrade your gear as you go along.
Screenshots for Tutorials
Speaking of tutorials and YouTube videos, if you’d rather have a faster turnaround or to make a guide that might be easier to follow, you can definitely include screenshots as visual content for your blog post.
For example, I included a number of screenshots to illustrate the various steps of planning YouTube video topics with TubeBuddy. If I were to publish that same blog post without the screenshots, the instructions wouldn’t be as clear or as easy to understand. The visual reference points make it much more useful and valuable to readers.
Google Slides Presentations
Most people think of PowerPoint decks as the kind of thing reserved for board meetings and business presentations. It’s true that slideshows can be really helpful in guiding a sales presentation or employee training session. But, they can also be incredibly useful when used in tandem with your blog posts.
And you don’t need to pay for Microsoft Office to do it. As you know, Google offers a free alternative in the form of Google Slides. It’s functionally equivalent to PowerPoint in just about every way, except it’s completely online and can work completely within your web browser. Just follow this tutorial for how to embed a Google Slides presentation into a post.
Infographics and Charts
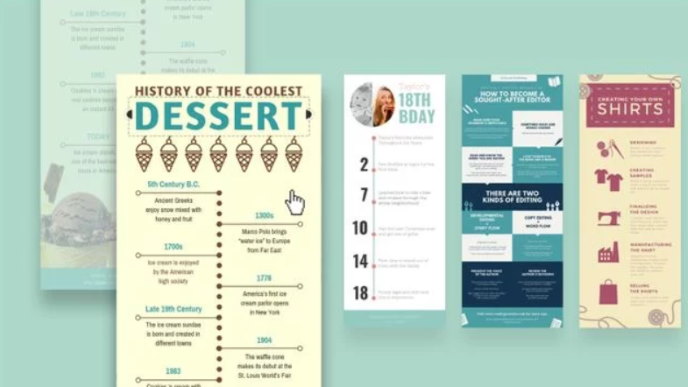
Meta-Chart is fantastic for simple graphs and charts, but what if you want to take it to the next level with infographics? You don’t need to be a desktop publishing expert to put together a visually attractive and engaging infographic. There are many tools available that make it easy, both free and paid.

For example, you can use Canva to create infographics the same way you might use it to make social media posts and YouTube thumbnails. Just as pie charts and bar graphs can bring data to life, infographics can make more complex concepts and large sets of data easier to digest and understand for your readers. They’ll take time to create (or you can always outsource it), but they’ll really make your content stand out from less attractive competitors.
No comments:
Post a Comment